> For the complete documentation index, see [llms.txt](https://help.aranet.com/llms.txt). Markdown versions of documentation pages are available by appending `.md` to page URLs; this page is available as [Markdown](https://help.aranet.com/aranet-cloud-page/aranet-cloud-landing-page/user-interface-and-core-features/dashboards.md).
# Dashboards
Dashboard is the main display you see when you open Cloud. A dashboard shows sensor data and gadgets that provide different types of information to aid you and your workspace members as you monitor and track measurements and your environment. Each user can create their custom dashboard (up to 10 dashboards per user) to see only the data that they are interested in. Dashboards can be named and shared with other workspace members. Dashboard contains **Tiles** - items that display some information.
### Dashboard view
1. Tabs of User's chosen dashboards
2. Manage dashboards button
3. Current dashboard name
4. Fullscreen mode switching button (press "Esc" to exit fullscreen mode)
5. Dashboard "Edit" button (see detailed below)
6. Tiles
When you start using Aranet Cloud your dashboard is empty:
Pressing on **CREATE DASHBOARD** opens New dashboard creation pop-up window (the same window is accessible when Dashboard "Edit" button (**5**) is pressed):
Here, you can set the dashboard type (private/shared), name it, and add notes specific to the dashboard if needed. After you are done with setting dashboard information, click **CREATE** button to finish:
New dashboard tab appears in the favorites dashboard list and you are offered to add tiles to this dashboard:
Pressing on **Manage dashboards** button (**2**) opens a pop-up window presenting all shared dashboards in your workspace. Marking check-boxes adds dashboards tabs to the favorite and to the **MY CHOICE** list:
To get more information about the dashboard, simply move the cursor to the information icon:
After clicking on **"Edit"** button pop-up menu opens:
Selecting "**Edit this dashboard**" will activate additional buttons:
1."**Edit dashboard data**" allows changing data entered at the dashboard creation stage or **deleting the** current dashboard.
2\. Allows you to **"Rename"** the tile.
3\. and 4. allow you to either **"Copy"** or **"Delete"** the tile.\
5\. **"Edit tile"** allows you to edit the parameters of the tile.
6\. and 8. Allows you to **"Resize"** or **"Move"** the tile.
7\. Allows you to switch to mobile view.
Arranging tiles in desktop view and in mobile phone view differs. While in desktop view, the position and size of the tile can be chosen almost freely, in mobile phone view, only **vertical** tile arrangement is possible, and three tile sizes are available - **Small, Medium, Large**
To **exit** dashboard editing mode, click the dedicated button.
Tiles can be created by clicking on **CREATE TILE button** on the empty dashboard or in the lower right corner:
This will open a window presenting available tile thumbnails:
Click on the desired tile thumbnail to open the tile configuration window. The number of available tiles depends on the sensors or virtual sensors that you are using or that are connected to the base station.
**The current Aranet Cloud version includes the following types of dashboard tiles:**
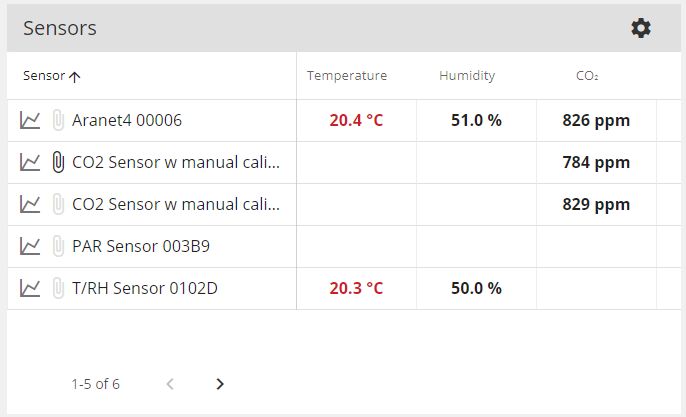
### **Sensor table**
Sensor table displays a sorted table with user-chosen sensors.
This tile configuration allows:\
1\) selecting and filtering sensors (by Metrics, Type, Location, Tag);\
2\) choosing visible columns (Metrics);\
3\) sorting sensors in a table by Name or the value of the Metric\
4\) selecting tile size (Small, Medium, Large).
If you have more sensors than the table is available to show, you will see the button SHOW ALL, to see all sensors in the table.
### **Line charts**
Line charts - display a line chart diagram of a few sensors.
This tile configuration allows:\
1\) Selecting and filtering sensors (by Metrics, Type, Location, Tag);\
2\) Selecting metric data to display;\
3\) Apply Time filter\
Also you can choose to hide/show legend, enable/disable zoom and select tile size (Small, Medium, Large).
### **Sensor widget**
Sensor widget - displays one sensor's current measurements. The sensor widget can include a trendline that displays measurement changes within a defined period. \
\
This tile configuration allows:\
1\) Selecting and filtering sensors (by Metrics, Type, Location, Tag);\
2\) Selecting metric data to display;\
3\) Selecting trendline (None, Last Hour, Last 24 Hours, Today;\
4\) Selecting the background color and selecting the background picture (if any are available in the sensor configuration)\
Also, you can hide the legend of the measurement trendline starting day and select tile size (Small, Medium, Large).
### **Horizontal sensor widget**
Horizontal sensor widget - displays the sensor's data in a horizontal line view.\
\
This tile configuration is the same as the **Sensor widget**.
### **Gauge widget**
Gauge widget - displays one sensor, one metric data in "speed-o-meter" view.
To add a gauge widget, press on "Create Tile" button and choose the gauge widget. After that, you can set up a metric for which gauge widget is made.
Then select the sensor, and the widget configuration will be available. You can change your tile name, enable or disable thresholds for the widget, which are colors, labels, and metrics, and select tile size.
Similarly, you can adjust the Gauge widget to your own needs. Here is an example of how a finished humidity gauge might look:
### Line widget
Line widget - multiple sensors, one metric visualization in linear view with custom-defined colors and thresholds.
The tile can be created in a usual way, from the widget list. To proceed, you need to select a metric from the metric list.
You can choose as many sensors as you need. Then you can name your tile with a preferred name and set thresholds (colors, scales) in the same way as they were set in the gauge widget. Additionally, you can display the metrics in a vertical orientation if that suits you better.
Here is an example of how a finished temperature line widget might look:
### **Asset widget**
Asset widget - one asset data visualization with the option to switch between measurement points.
This tile configuration allows choosing the Data source (asset), and other settings same as for the Sensor widget.
### **Asset measurement table**
Asset measurement table - displays list of selected assets shown with measurement points and selected metrics.
This tile configuration is the same as of **Sensor table**.
The number of columns relies on the type of measurements that sensors have, which can be added to the asset.
### Active alarms table
**Active Alarms table** - displays list of active alarm rules and totals of applied objects and active alarms.
This tile configuration allows selecting Metrics, Columns, Sorting order and Tile size.
Here is what a finished widget looks like:
To see which sensor has alarm, simply press on type of alarm:
### Rule alarms widget
**Rule Alarms widge**t - displays list of active alarms of selected rule:
Tile configuration allows:\
Selecting source Rule (only one per widget); Selecting colums; Sorting and selecting tile size (Small, Medium, Large).
### Public tile widget
Before creating a public tile widget, you need to create a public tile in the Public tiles tab.
After creation, you can head to Public tile widget creation.
To create a widget, you need to select which public tile you would like to make a widget.
Here is how it looks when it is finished:
Configuration and sharing are described in the dedicated topic: [Public Tiles](/aranet-cloud-page/aranet-cloud-landing-page/user-interface-and-core-features/public-tiles.md) and [Sharing Public Tile Data](/aranet-cloud-page/aranet-cloud-landing-page/user-interface-and-core-features/public-tiles/sharing-public-tile-data.md)
### Integrations table
**Integrations table** - displays the list of configured integrations and their statuses.
This tile configuration allows: Searching configurations by Name; Selecting columns; Sorting and selecting tile size (Small, Medium, Large).
### Integration widget
**Integration widget** - status of selected Integration, its last run time, schedule, and the process runs
### Floor plan widget
**Floor Plan widget** - fixed view of floor plan
To configure this tile, you need to select one of the previously created Floor plans. Then give a title for your plan; it can be literally the name of a building or a type of structure. You can set up what type of information you want to see in the widget - Measurements, Alarms, or Objects. Depending on which sensors were added to the Floor plan, you can choose what type of measurements you want to see in the widget. Then configure the positioning of the plan on the tile if needed; otherwise, press the **CREATE** button to finish.
### Min, Max, Average widget
The widget allows you to monitor the minimum, average, and maximum measurements in a specific time range.
Here you can choose the metric you would like to analyze, the source of data, and name your tile as you need. Also, you can set up a time filter to see values in the desired time range.
### CO₂ widget
The widget allows you to set up a tile with CO₂ measurement data.
Here you can: Select data source (only for sensors that have a CO₂ sensor), name your tile, set up a specific trendline, and take a look at set CO₂ thresholds:
If you need to set up different CO₂ thresholds, you can press on button CO₂ thresholds. By pressing, you will get a notification about being redirected to another page, and that it is recommended to save tile before redirection.
By pressing on go to settings, you will be redirected where you can set up your own thresholds.
After you have saved your tile and set up another thresholds, it will be applied to the tile immediately.
---
# Agent Instructions
This documentation is published with GitBook. GitBook is the documentation platform designed so that both humans and AI agents can read, navigate, and reason over technical content effectively. Learn more at gitbook.com.
## Querying This Documentation
If you need additional information that is not directly available in this page, you can query the documentation dynamically by asking a question.
Perform an HTTP GET request on the current page URL with the `ask` query parameter, and the optional `goal` query parameter:
```
GET https://help.aranet.com/aranet-cloud-page/aranet-cloud-landing-page/user-interface-and-core-features/dashboards.md?ask=&goal=
```
`ask` is the immediate question: it should be specific, self-contained, and written in natural language.
`goal` is optional and describes the broader end goal you are ultimately trying to accomplish on behalf of the user. GitBook uses it to tailor the answer towards what is most useful for that goal.
The response will contain a direct answer to the question and relevant excerpts and sources from the documentation.
Use this mechanism when the answer is not explicitly present in the current page, you need clarification or additional context, or you want to retrieve related documentation sections.